2020 | OSKAGraphicIllustrationInformation GraphicsPrinted MediaTypography
OSKA reports – data made simple
OSKA’s collected data is helping us to learn and teach the right skills. It also helps us to see what has been done and where our nation is headed. It tells us how many professionals do we need to teach in the next 10 years and how many people already have a job in that area. It is also heavily used to fact check politicians and easily find real data before making decisions about the future of your area of expertise.
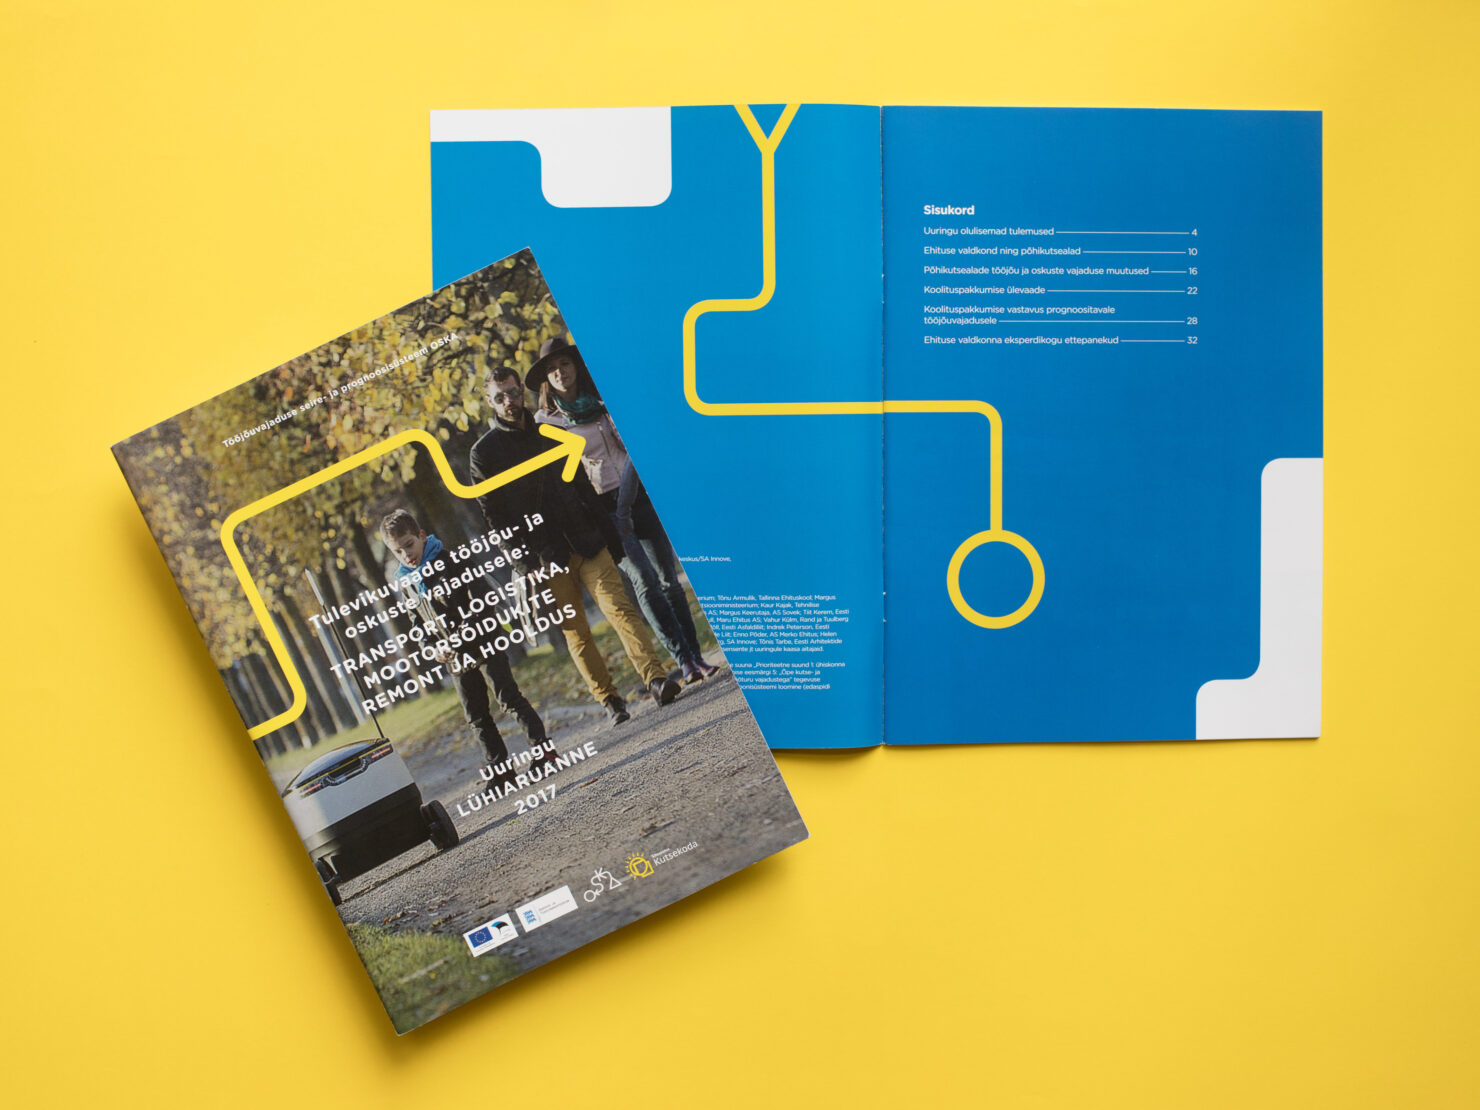
OSKA report is a summary of a bigger database, that helps different schools, companies and even our government make decisions based on real data. If this data is hard to understand or translated without a certain focus, then the people in charge will base their plans on imaginary facts and will eventually fail us all.
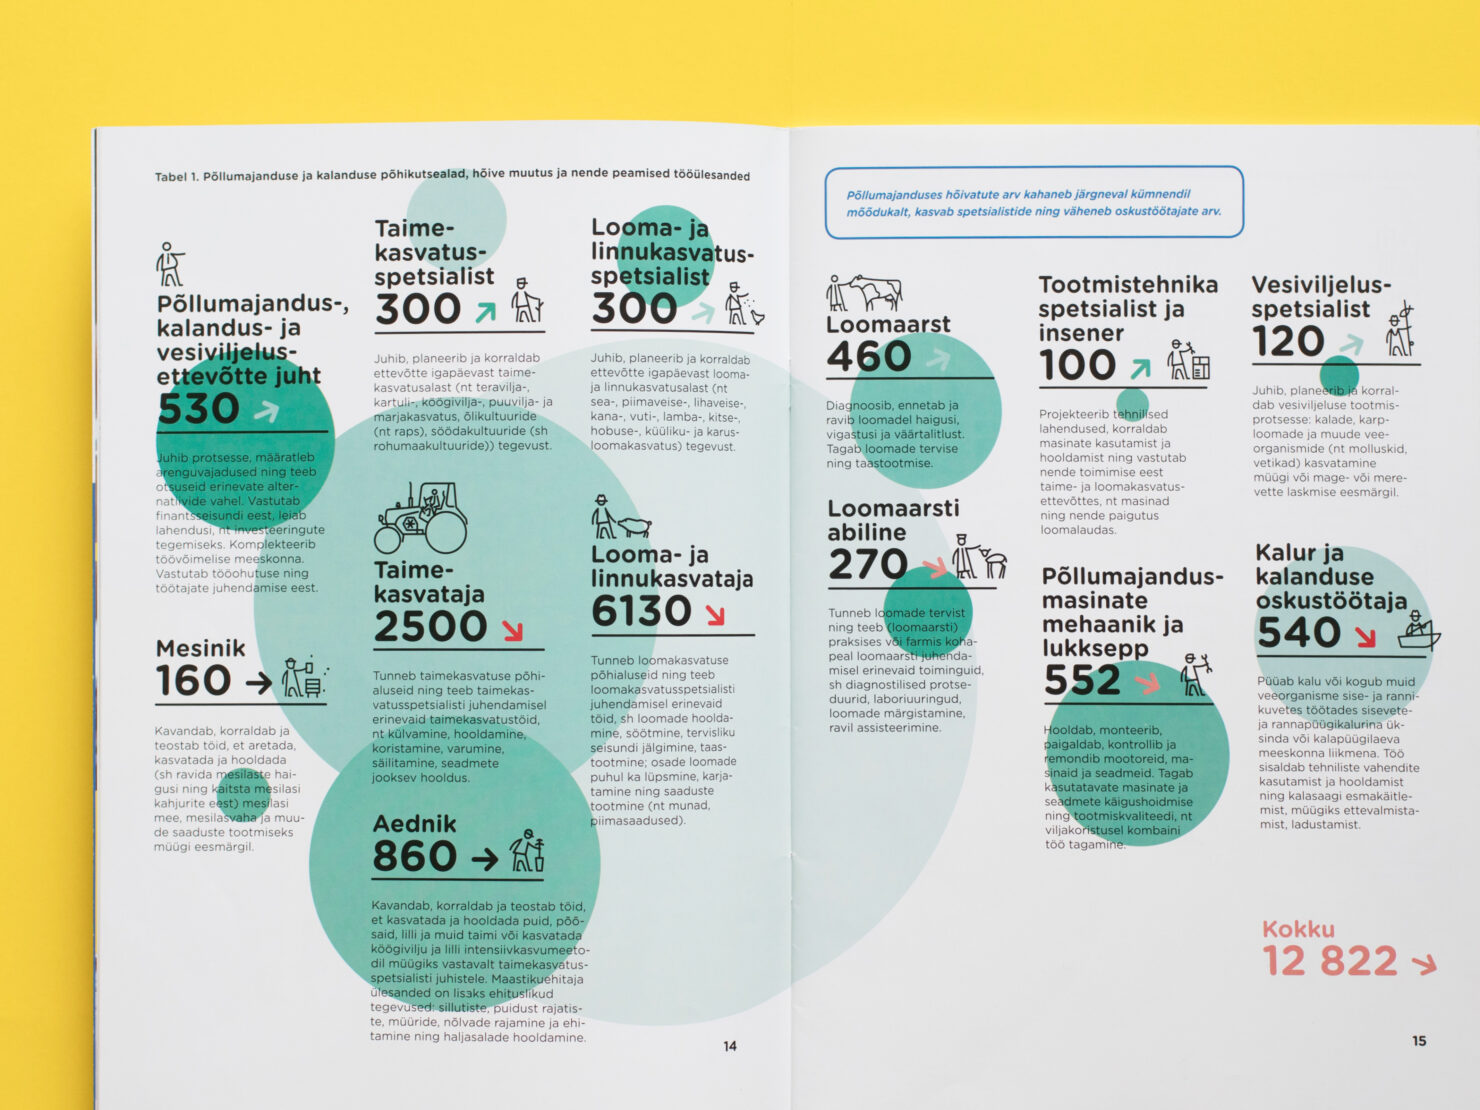
So we developed and designed guidelines on how to express large amount of data in a simple and understanding way.
OSKA’s way of processing data will help people understand and trust the data that has been collected.
In addition, well visualised data will make people want to see and understand research before deciding something. Therefore reducing the waste of time and resources.
Practice makes perfect…sense
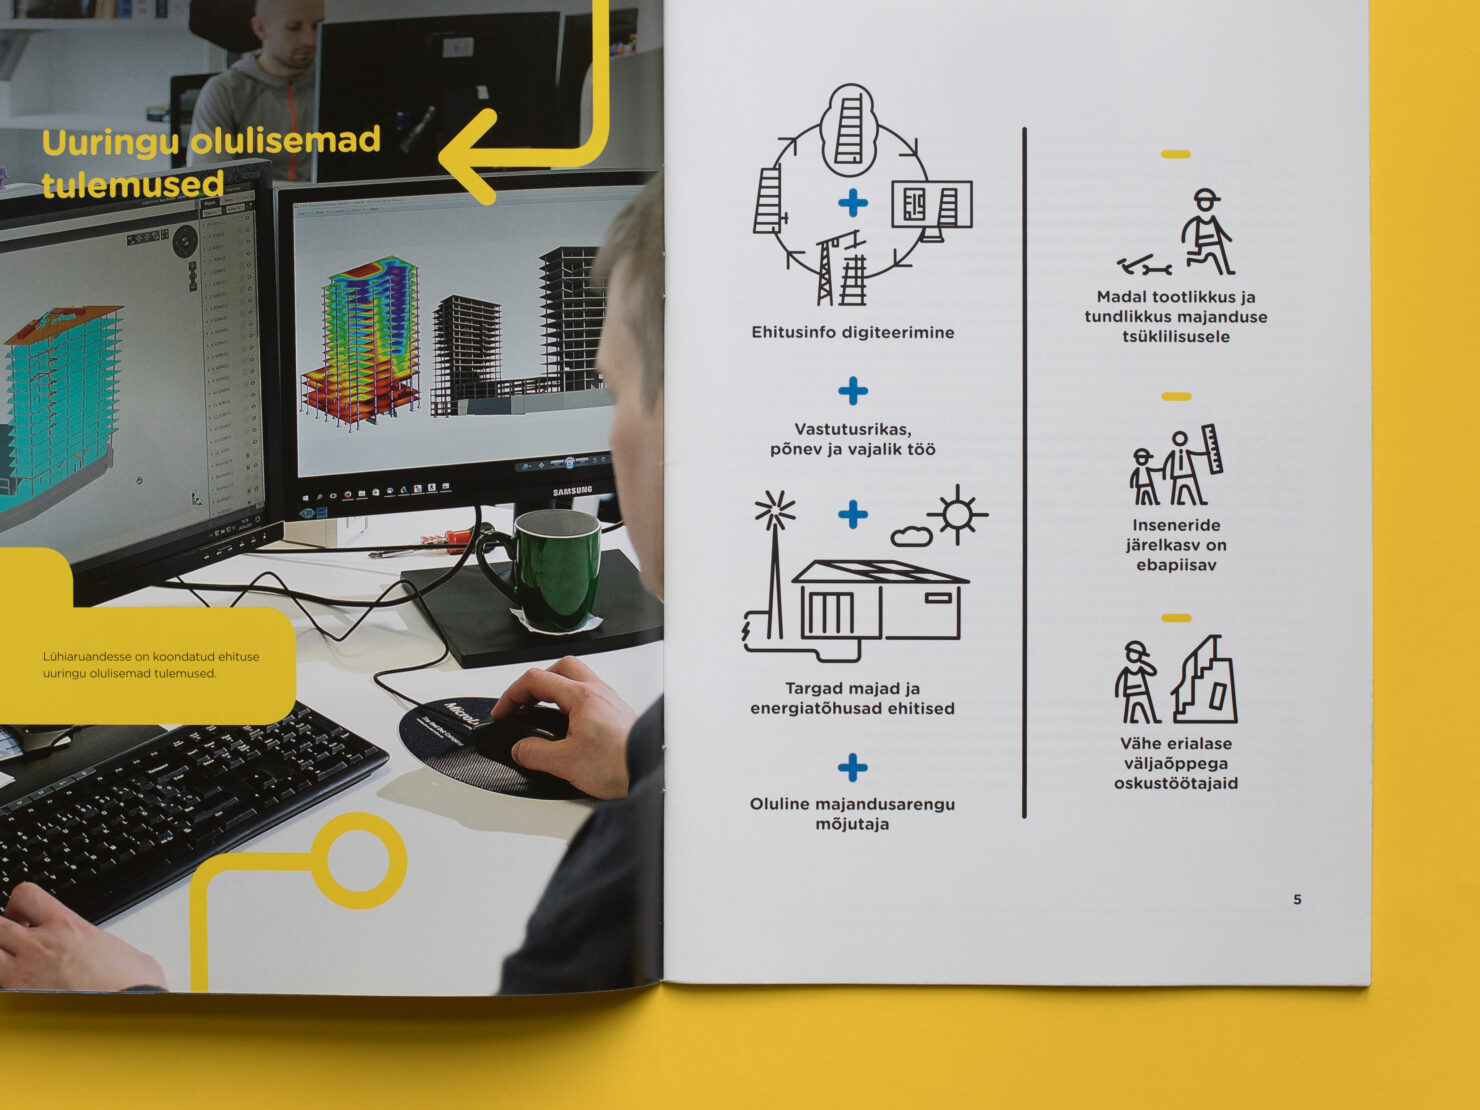
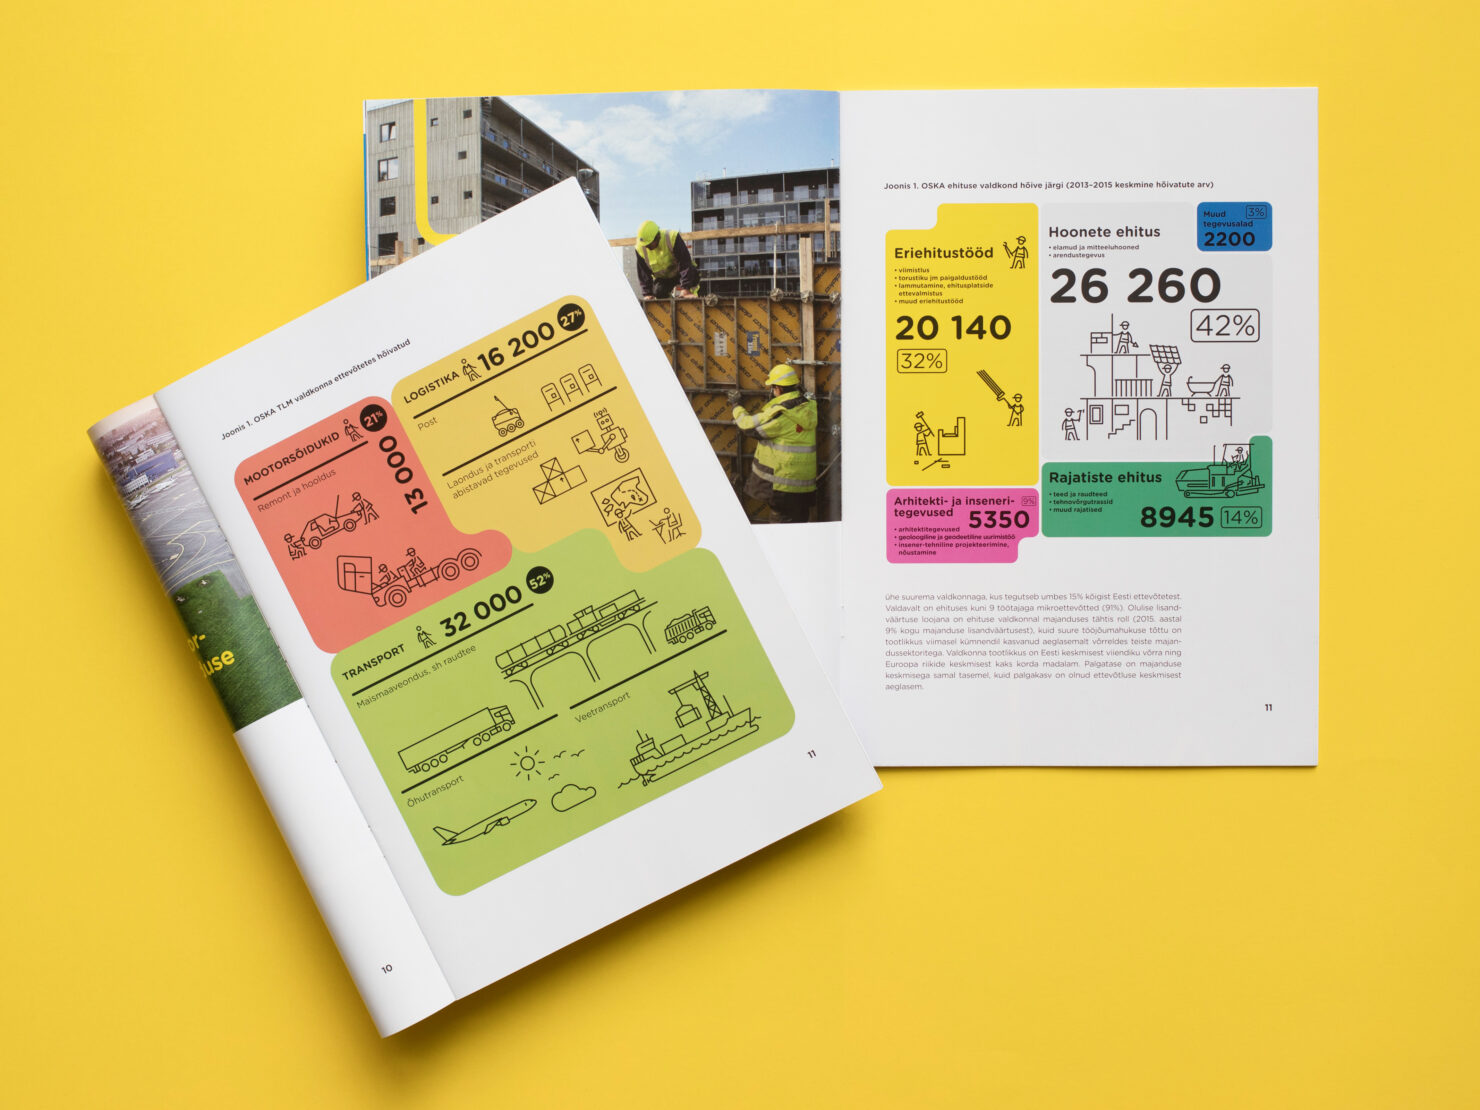
The new system took some time to perfect, but through that we have created a strict system of principles, on how OSKA reports use colours, illustrations and fonts to communicate data to its readers. In addition, we also helped OSKA to better their focus on collecting data and showed them how they could create simple and easily understandable graphs and illustrations that made sense to everyone.
Data made simple and user-friendly
In addition to long texts and big numbers, every report answers the main questions with a one-pager solution that simply shows you what changed through the years, what is the situation now and where are we headed in the future.
In conclusion
OSKA now speaks about important data in a way that we all understand. They take complicated numbers of different systems and give them meaning and context. Understandable OSKA reports help our society create a more data-based future.
Team
- Kristian Kirsfeldt – Creative Director
- Jaak Peep – Designer
- Siim Tikk – Designer
- Ivo Visak – Project Lead
- Alan Reiss – Project Lead
Partners
- OSKA – Client